
CY26 Season Analysis
CY26 Annual Summary | Case Study
The CY26 rice season highlighted the impact of water constraints and extreme weather, with exceptional management playing a key role in crop performance and results.
Key weather events for the CY26 season included:
→ Excellent conditions for ground preparation, planting and establishment.
→ Low opening water allocations and a dry seasonal outlook which limited planted area.
→ Minimal in-crop rainfall leading to higher-than-average water use for many crops.
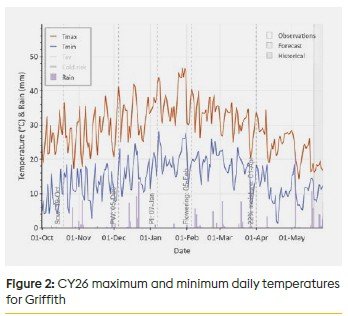
→ Extreme temperatures (44–47 degrees) in the last week of January, at the young microspore to early flowering stages, which capped the yield potential of many crops.
→ Timely crop maturity (10–14 days later than CY25), milder conditions during grain maturation, timely drainage and harvest, and minimal late-season rainfall favoured high-quality grain across all crops.
Average temperatures were experienced during establishment and vegetative periods. With little to no rainfall during establishment, crops were sown in the recommended sowing window and established well.
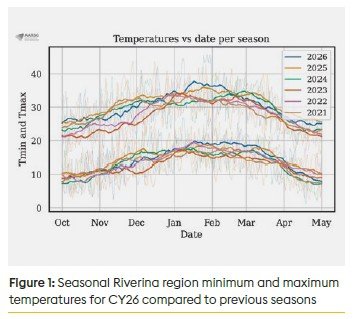
Temperature conditions from panicle initiation (PI) to flowering were well above average, with significantly higher average maximum and minimum temperatures than CY25. Temperature-wise, this period was very similar to CY19 and CY09. There were no significant cold weather events throughout the critical young microspore stage.
However, the week of extremely high heat (topping out at 47 degrees) at the end of January was a critical factor in determining the yield of many crops by causing heat-induced sterility.
Milder conditions were experienced through the late summer and early autumn period, from flowering to harvest. Overnight averages were higher than in previous years but had minimal effect on crop development during the grain filling and dry down periods. All crops experienced good conditions throughout dry down and harvest, with little to no rainfall recorded throughout harvest. Timely drainage and harvest management decisions allowed growers to deliver exceptional quality grain.
Crop dynamics
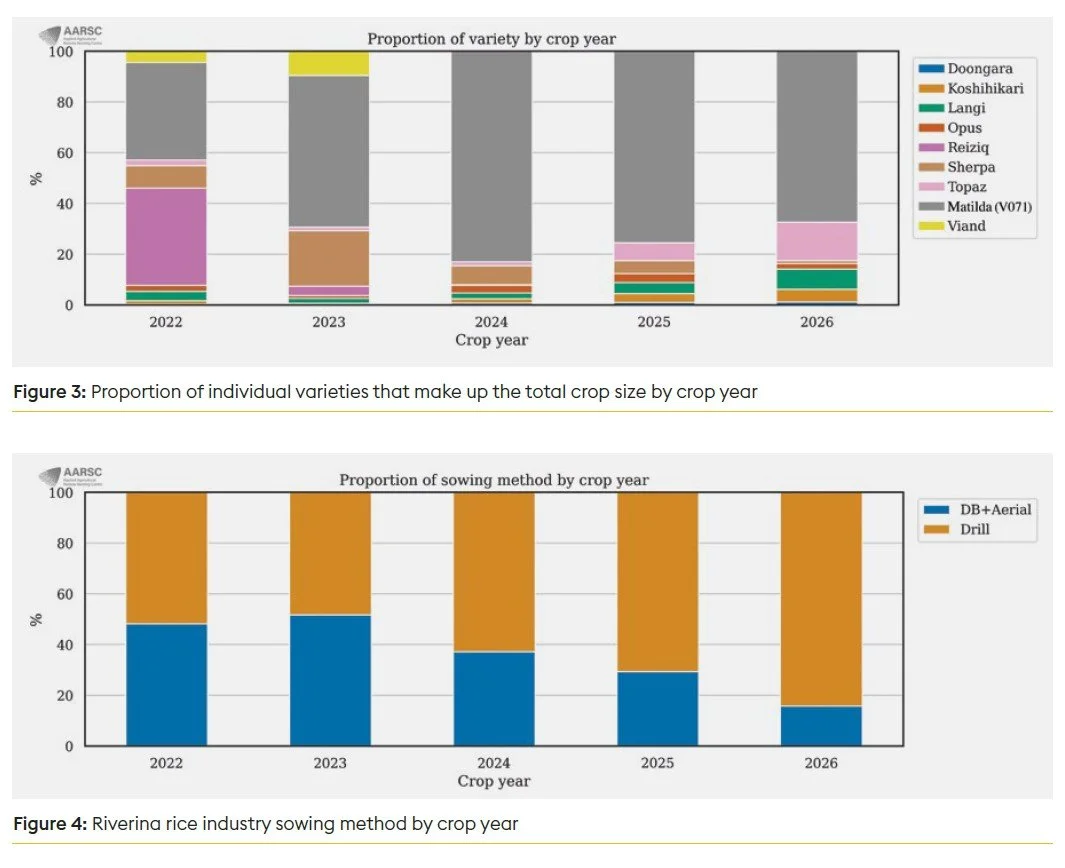
The CY26 crop area was reduced due to low water availability, with approximately 10,000 ha grown across all regions with 70% planted in the Murrumbidgee Valleys and 30% in the Murray Valley. Most of the crop was the bold medium grain variety Matilda (V071), however, there was a relatively high area sown to long grain varieties Topaz and Langi, and short grain Koshihikari.
Of the total area, 84% was direct drilled, with growers opting for the most water efficient strategies. Most of the remaining crop area was dry broadcast in the MIA, with a few growers still opting for aerial sowing where it suited their farming systems. With minimal in-crop rainfall and extreme January temperatures, water use was between 1–2 ML/ha higher than average for most growers.
Crop yield results
Yield performance
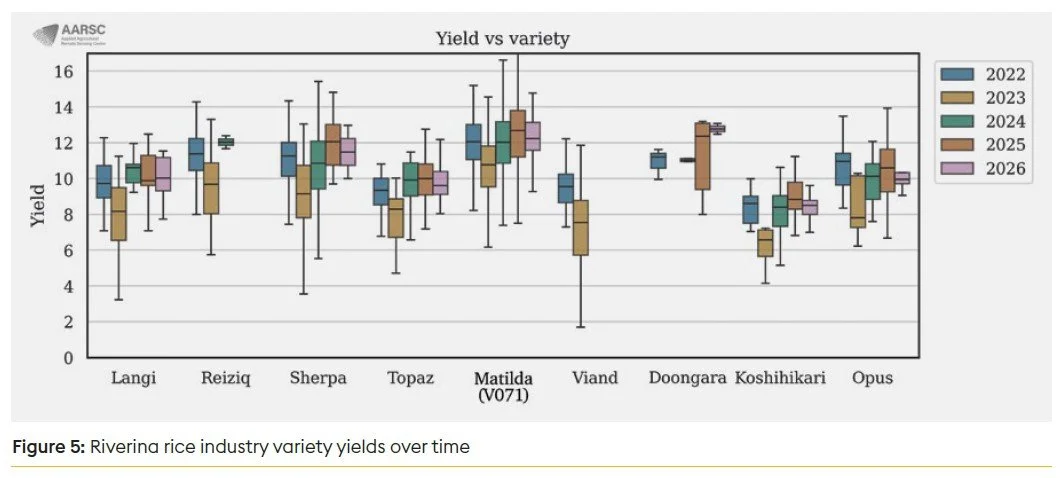
CY26 yields were slightly above the five-year average for all varieties. Most Matilda crops achieved just above-average yields for the respective growing regions. While the potential was certainly there, we didn’t have the ultra-high yielding crops of the past two seasons. This was driven by the significantly higher sterility in Matilda this season due to the extreme heat at the end of January (for more information see case study - When strong crops yield less: heat stress and rice sterility and case study - CY25 vs CY26: quality won or lost in timing).
Grain quality
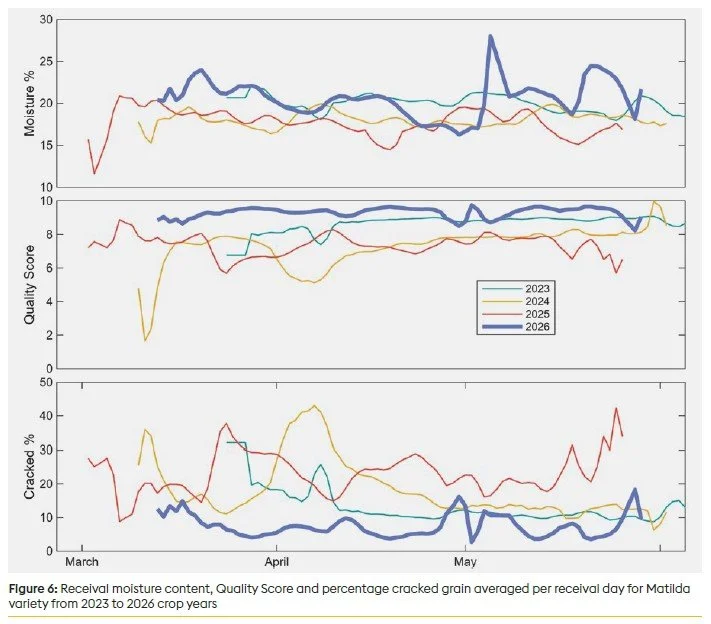
Exceptional grain quality was the highlight of the season, with all varieties exceeding expectations. Matilda quality rebounded to an average of over nine after the challenging results of CY24 and CY25, with all specialty varieties also yielding outstanding whole-grain results. While some of this improvement in quality can be attributed to conditions during dry down and harvest, most of the improvement was a direct result of timely crop management. The majority of crops were harvested 10–14 days later than last season, at an average grain moisture of 19.6%.
Yield gap analysis
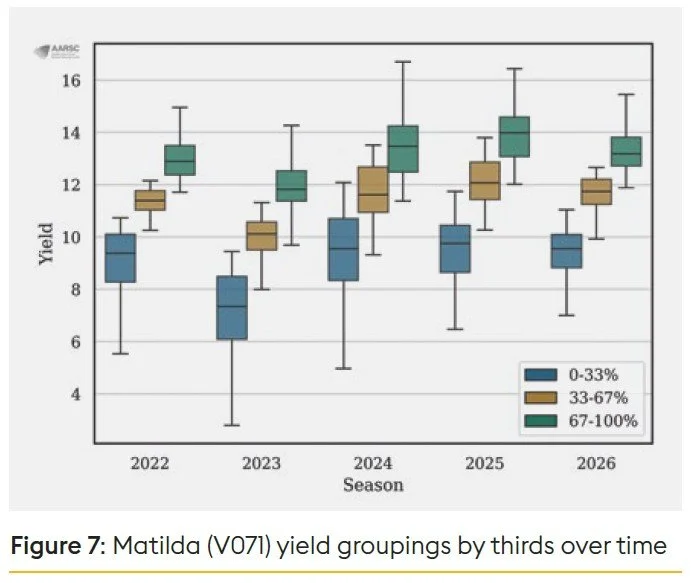
Reviewing crops according to yield results across the industry (Matilda only), showed average yield groupings of 10.9 T/ha for the bottom third, 12.2 T/ha for the middle third and 13.5 T/ha for the top third of crops.
The last two seasons indicated a 4 T/ha yield difference between the highest and lowest thirds. This season was tighter; however, there is still a 2.6 T/ha difference. Data collected over 70% of the crop showed, again, that there is little difference in nitrogen rates being applied. Assuming water use is the same across each yield grouping, the yield difference between the lowest thirds and highest thirds represents a 25% increase in water and nitrogen efficiency, and 34% increase in profitability – an extra $1,400/ha in the pocket.
Nitrogen and yield efficiency
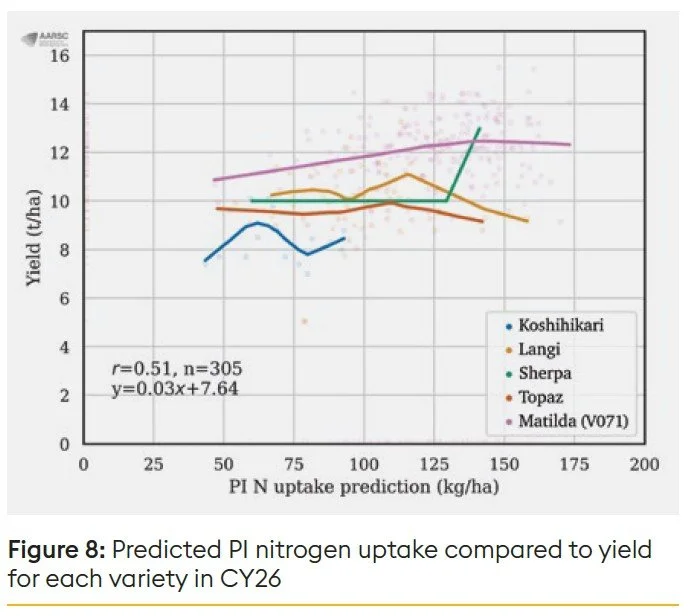
Crops in the top-yielding group continued to have a higher and earlier peak in their N Index growth curve, with higher Matilda yields directly related to higher and more consistent nitrogen uptake at PI, as shown in Figure 8. Looking at the V071 curve, yield peaked at around 135 kg N uptake, consistent with agronomic research published over multiple seasons. Balancing fertiliser nitrogen inputs with crop demands remains a key management decision to optimise profitability. For more detail, see the case study Nitrogen: cost, efficiency and return.
Growth curve insights
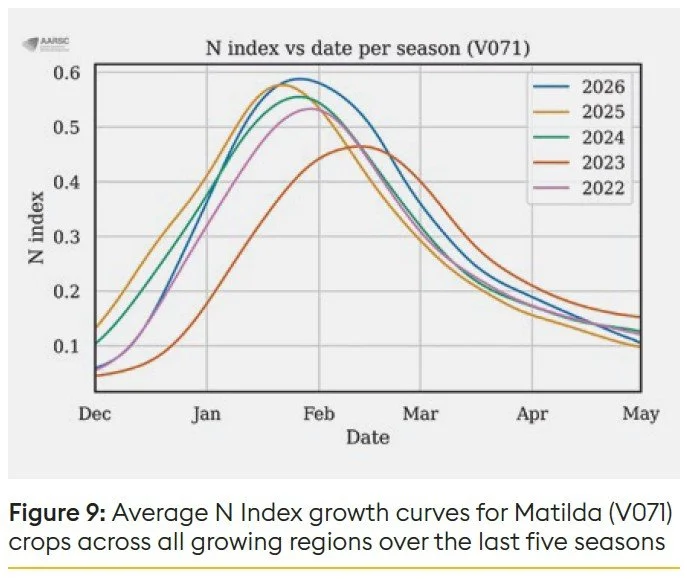
Comparing the average N Index curve for Matilda crops in CY26 to the previous four seasons reveals some interesting insights. Firstly, the early-season growth rate in CY26 was significantly higher, reflecting the cool start and warmer pre-Christmas temperatures, with very rapid crop growth and biomass accumulation. This is shown by the steeper angle of the curve from permanent water in November to the peak just before flowering in late January.
Secondly, the peak of the curve was similar to the high of CY25, suggesting yield potential was similar. This curve is also much broader, which suggests a longer period of crop development throughout the flowering and early grain fill period. The later (and broader) peak of the curve shows that most crops were in the optimum window for dry down and harvest.
Fertiliser use benchmarking
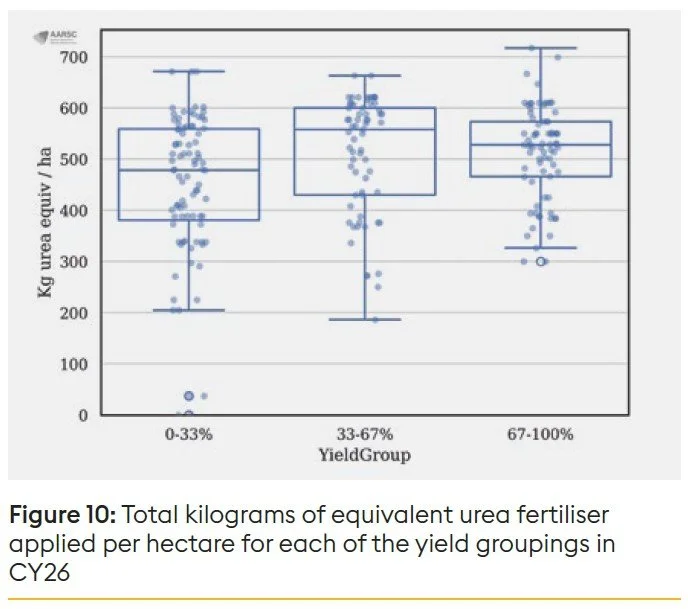
In order to compare nitrogen application rates across fertiliser types, grower data was normalised to a consistent figure of the total kilograms of urea-equivalent fertiliser applied per hectare. This included urea, sulphate of ammonia and starter fertiliser nitrogen sources. It showed a minimal difference in the total amount of nitrogen fertiliser being applied across all yield groupings. This is consistent with previous years’ benchmarking data and again highlights the need to assess efficient and effective nitrogen use for maximum returns (see page 40). Note that total applied urea equivalent of 472 kg/ha quoted in the highlights does not include starter fertiliser nitrogen to ensure consistency with previous seasons.
Heat stress and sterility
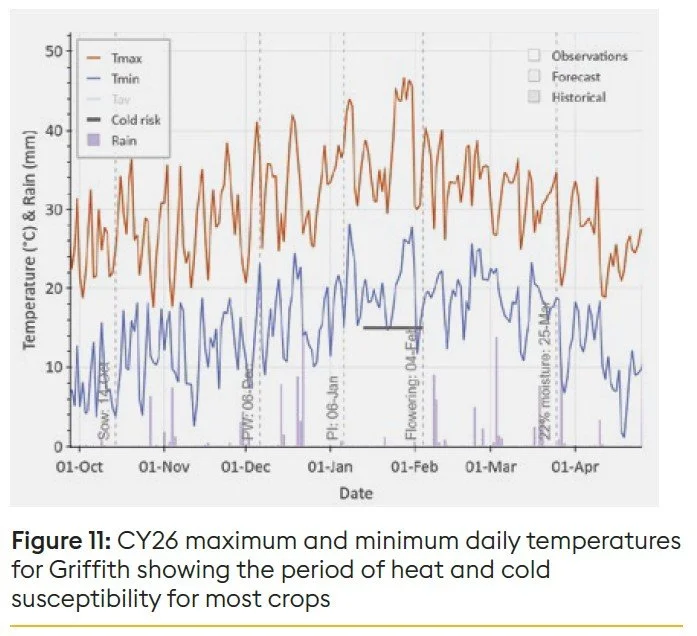
Rice Extension took 117 one-metre square quadrant cuts to measure a range of crop parameters. Matilda had between 15–30% sterile florets (flatheads) compared with the usual count of less than 5%. Given no significant cold weather throughout the young microspore stage, crop symptoms and data indicates that this high sterility percentage was due to the extreme heat of late January. The graph above shows the observed maximum and minimum temperature and predicted phenology dates for an average Matilda crop in the MIA throughout the CY26 season.
The record heat from 24th to 31st January is the likely cause of the sterility in many crops.
Literature shows that rice is most sensitive to heat stress during young microspore where it can significantly reduce pollen viability, especially temperatures above 39/30˚C (day/night).
Pollination at flowering is also impacted by the same temperatures; however, the impact on yield is not as severe.
Two crop conditions were observed as a response to this heat period. Crops where PI happened in the first week of January would have been towards the end of microspore when the heat occurred.
As literature suggests, this directly affects pollen formation and anther development, resulting in high sterility. Symptoms of this were sterile florets scattered throughout the whole panicle as opposed to sections of the panicle.
The other condition was observed in a smaller percentage of very early crops, or those that reached PI between Christmas and New Year. These crops were at flowering to early grain fill stage – a peak period of crop energy use and the high heat likely caused a condition called ‘xylem cavitation embolism’. Basically, the plant sap ‘cooked’ in the plant causing whole sections of heads to become sterile. In specific small areas such as cut areas and more advanced bottom bays, yields were dramatically reduced, by up to 50%.
Overall, the CY26 season highlighted both the resilience of rice and the importance of timely management decisions in shaping performance and profitability. Despite adverse seasonal conditions, growers who established crops well, managed nitrogen and water strategically, and timed drainage and harvest effectively, achieved solid yields, exceptional grain quality and profitable outcomes.