
From data to decisions: the Rice Management Dashboard
CY26 Annual Summary | Case Study
The Rice Management Dashboard (Dashboard) is a unique, industry-leading tool developed specifically for the Australian rice industry. It brings together paddock-level data, crop modelling and satellite imagery in a way not currently available in other cropping industries.
The Dashboard allows growers and agronomists to monitor entire paddocks as well as individual zones within a crop, tracking differences in timing, growth rates and nitrogen status. It also predicts key crop stages including panicle initiation (PI), flowering, grain dry down and harvest timing, supporting more accurate and timely decisions.
This level of detail provides rice growers with precision insights that many other industries are still working towards, positioning the rice industry at the forefront of digital agriculture.
Adoption and use
The Dashboard has been rapidly adopted, with over 95% of growers and agronomists using it in CY26,
a strong result for a tool only recently introduced at paddock scale. Usage peaked at key decision points including:
→ PI: assessing nitrogen status and determining PI nitrogen requirements
→ Maturity and drainage: supporting harvest timing and crop management decisions
This strong adoption highlights the Dashboard’s value in driving confident decision-making.
Turning variability into opportunity
One of the most powerful features of the Dashboard is its ability to analyse within-paddock variability using zonal imagery across all crop stages back to 2018. Growers can use this to:
→ Identify high- and low-performing areas within paddocks
→ Compare crop performance across different seasons
→ Assess biomass, which is a more reliable indicator of crop potential than yield maps alone
Importantly, the Dashboard provides multiple layers of insight:
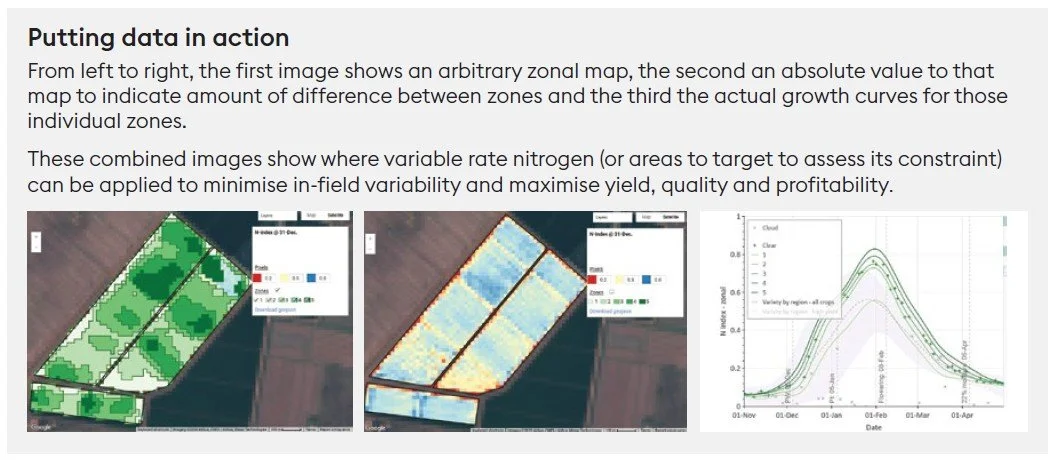
→ Zonal (relative) maps showing where variability occurs
→ Absolute values that quantify the size of differences between zones
→ Growth curves that track how each zone performs throughout the season
For example, growers can move from a simple variability map to understanding exactly how much difference exists between zones and how those zones are tracking over time. This insight allows timely management to address zonal differences if applicable and is backed by multi-season, ground-truthed data, giving confidence to act on the information.
Benefits for growers and industry
Using the Dashboard, growers and advisors can:
→ Improve timing of key decisions, particularly nitrogen applications prior to and at PI if required
→ Target inputs such as fertiliser to specific zones within paddocks
→ Identify underperforming areas and investigate constraints
→ Plan variable-rate strategies for future rice crops or across rotations
→ Reduce variability and maximise yield, grain quality and profitability
At an industry level, the Dashboard demonstrates how integrated data and digital tools can lift performance across an entire production system, setting a benchmark that other cropping industries are striving to achieve.
The Rice Management Dashboard is more than a monitoring tool. It is a globally unique capability that puts the Australian rice industry ahead in digital decision-making. By turning complex data into practical, paddock-level insights, it enables growers to make better decisions at the right time and get more value from every hectare.