
Same paddock, different seasons and varieties—but the same variability
Using the Rice Management Dashboard early to maximise yield potential
Published: September 2026
Looking back at imagery from previous rice crops in a paddock planned for CY27 can help identify and manage variability, with a view to maximising yield and minimising risk.
There is a consistent 4 t/ha yield gap between the top-yielding third and bottom-yielding third of Matilda crops. The Dashboard includes crop imagery dating back to 2018.
Combining this imagery with yield maps, cut-and-fill maps, soil testing and other available data can support proactive management decisions to maximise profitability and help reduce variability.
Example of three Dashboard images from CY24 focus site in the MIA
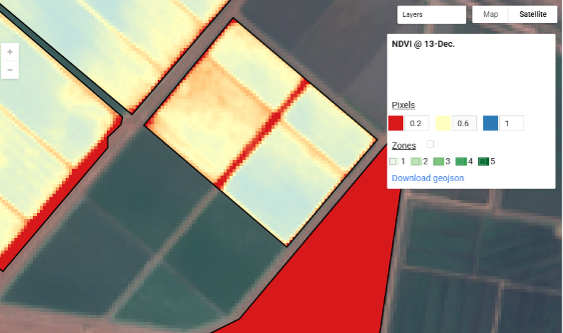
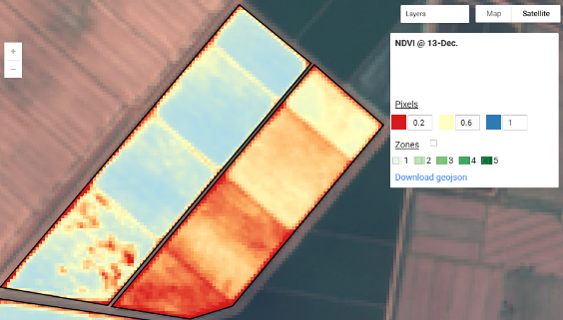
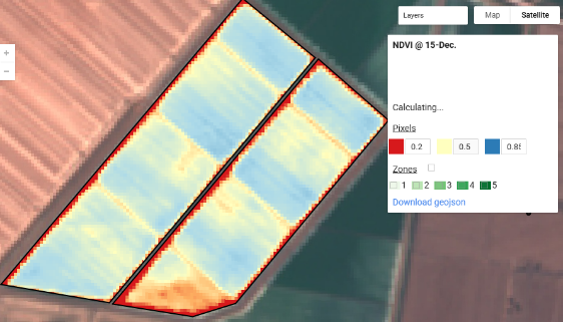
In this example, the top half of each bay is significantly different from the bottom half at the same stage of the season, regardless of the variety grown. The variability aligns almost perfectly with the cut-and-fill map. However, soil testing found no underlying constraints that would explain the difference. Establishment was consistent across the bays, and base nutrition and weed control were excellent, suggesting nitrogen was the primary driver.
Applying a blanket rate of nitrogen before permanent water to the western side of the paddock in CY24 resulted in a lower overall yield than on the eastern side, where variable-rate nitrogen was applied. Reducing the urea rate at permanent water in stronger areas and applying more in weaker areas—where plant population was consistent—produced a more consistent and higher overall yield.
Reviewing Dashboard imagery from previous seasons for paddocks planned for rice in CY27 can help target management and maximise yield without increasing overall inputs. Having all available information is critical to understanding the drivers of variability and deciding how best to use the information provided by the Dashboard.
If you do not fully understand what is driving variability in your previous crops, get in touch with Rice Extension to discuss how we may be able to support you this season.
Key takeaways
Review Dashboard imagery from previous rice crops where you plan to use the same paddock this season.
Compare imagery with yield maps, cut-and-fill maps, soil tests and other available information.
Look for recurring variability across seasons and varieties.
Consider targeted management, including variable-rate nitrogen, where the evidence supports it to maximise your yield potential.
Contact Rice Extension if you need help identifying the drivers of variability.